The statistical hypothesis testing framework
The relationship between power, sample size, effect size and type I error alpha
A second very important concept is the relationship of certain probabilities within the framework of statistical hypothesis testing.
There are several important concepts in statistics that are closely related when it comes to hypothesis testing.
-
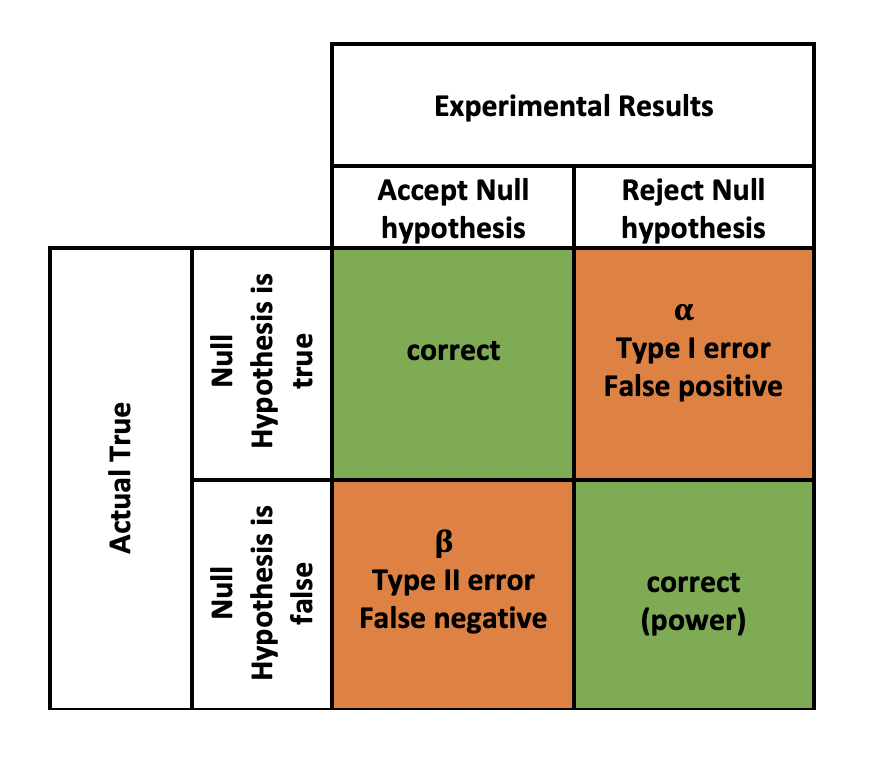
is the level of error that is accepted for erroneously rejecting the null hypothesis (although it is true) e rejected. It is usually set to 0.05 (one sided testing) or 0.025 (two sides testing).
-
Power is the probability of correctly rejecting the null hypothesis when it is false, and accepting the alternative hypothesis.
-
Sample size refers to the number N of observations in a study.
-
Effect size is a measure of the magnitude of a difference or relationship in the data, for example between to populations.

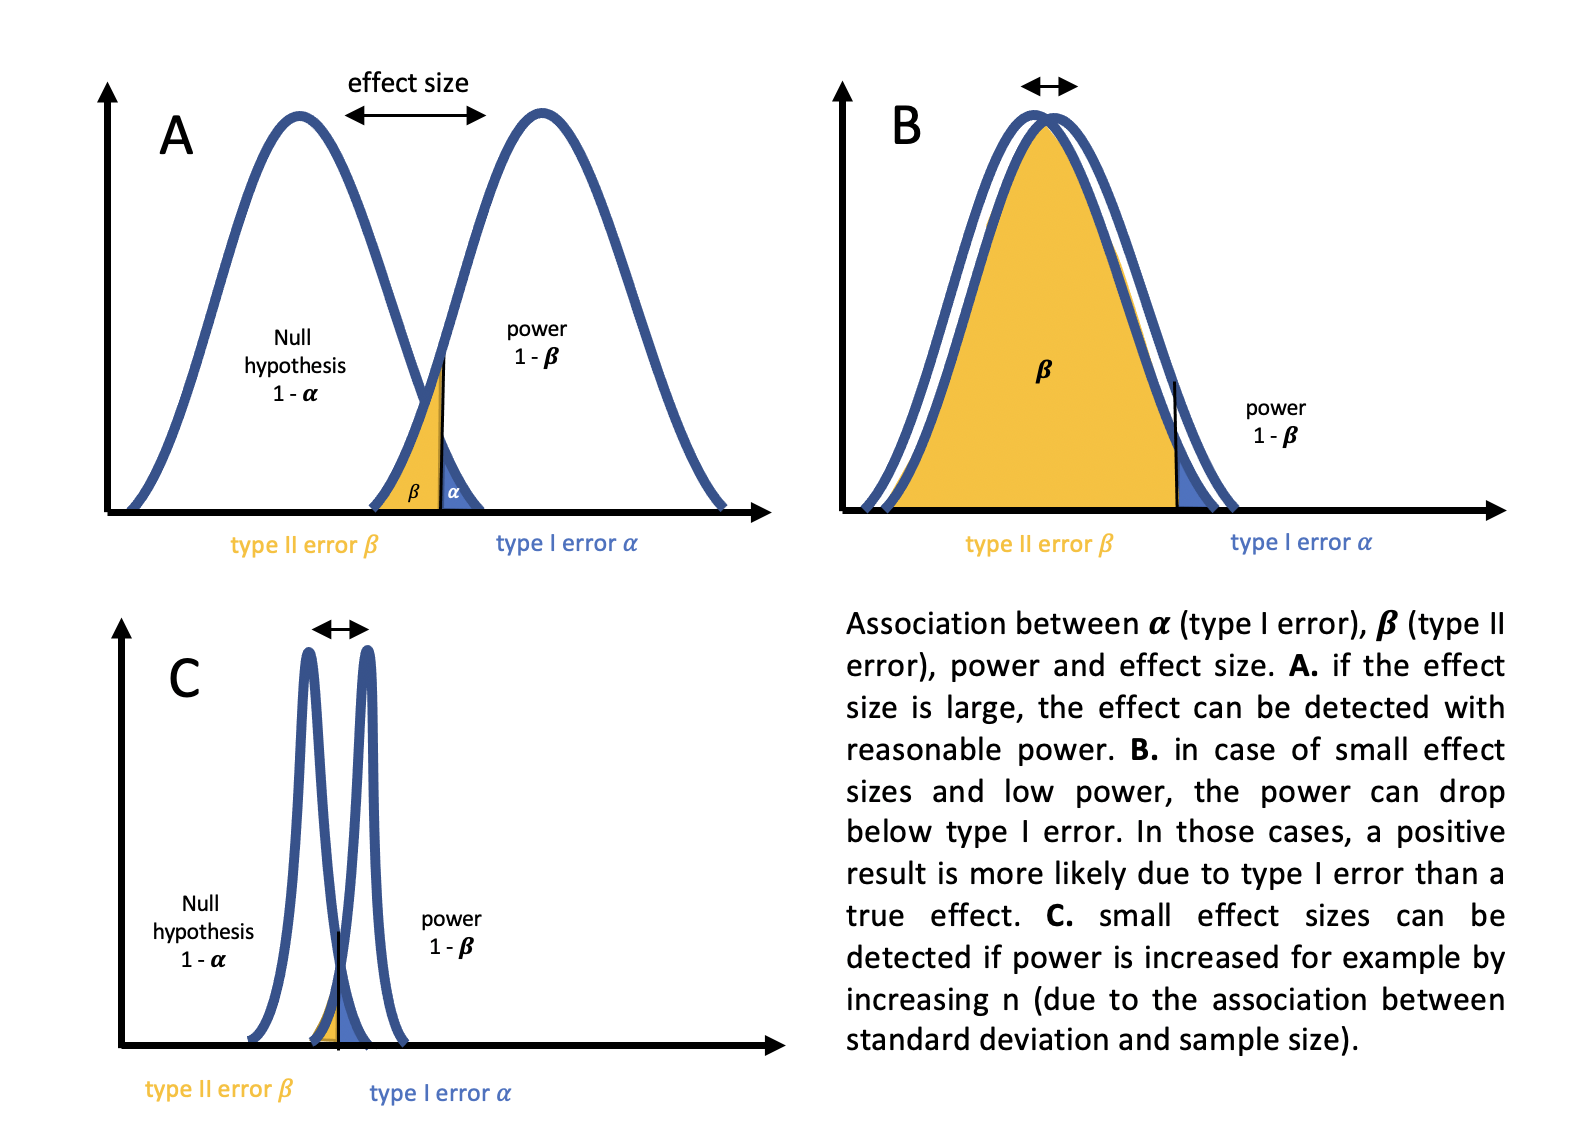
These concepts are interconnected because the choice of sample size, and effect size can all impact the power of a statistical test. For example, increasing the sample size can increase power, while decreasing alpha can decrease power. Similarly, larger effect sizes are more likely to be detected with greater power, while smaller effect sizes may require larger sample sizes to achieve the same level of power.

The relationship between standard deviation and effect size
The effect size is the difference between two group means and (the peaks in the figure above) divided by the standard deviation
Effect size
as we can see, the effect that can be detected is directly related to the standard deviation .
To given an example:
Let’s assume we have two group means = 0.4 and = 0.2 and two standard deviations = 0.5 and = 0.8. Let’s just plug in the means into the formula above:
Effect size
From the above we can directly see that the resulting effect size from those group means depends on the standard deviation in the denominator.
Let’s just test that:
Effect size = 0.4
Effect size = 0.25
Visually, this relationship becomes clear: A smaller standard deviation means a “narrower” distribution and less overlap between the curves. Thus, the effect size is an expression of how precise one is to measure a certain difference between two group means.
So, what makes a standard deviation small?
What makes the standard deviation small?
First of all, let’s remind ourselves of the relationship between variance and standard deviation:
Var =
thus: =
Let’s just remind ourselves that the variance is just the averaged squared difference of each point in the data set from the mean:
Var =
From ththe above we can see that teh variance Var is directly related to N (larger N leads to smaller variance) - and if we take the root to get back to the standard deviation:
=
Thus, as we can see, the standard deviation is directly related to - the larger the sample size, the smaller the standard deviation.
References: This paper and this website are really nice.