Why most research findings are false
In his famous paper “Why most published research findings are false” Dr. John Ioannidis proofs that most research findings are false. Given that his paper is quite technical, I will go over his rationale here again.
Concepts
1. R: the prior probability
The first concept that is introduced is R which is considered to be the relationship between “true relationships” and “no relationships” in all tests in a certain field before any test or study has been undertaken. We will discuss later why this consideration is important; first of all it is important to understand this concept. To give an example: If 20% of people have a specific disease (for example diabetes), then the probability of randomly selecting a person with diabetes without any other knowledge and tests from teh population is 0.2.
When the number of true relationships in a field = 0.2 and the number of no relationships = 0.8 then:
R = 0.2/0.8 = 0.25
Thus, R is just the ratio of true and false relationships before any study has been undertaken. Or, if you would select randomly, you you would find that 30% of tests turn out true and 70% turn out false.
From this, it is also easy to conclude that the pre-study probability of a true association is:
R/R+1 = 0.25/(0.25+1) = 0.2
which is exactly what we have defined before.
Similarly, the pre-study probability of selecting a no-association result is:
1/R+1 = 01/(0.25+1) = 1/1.25 = 0.8
Taking into account the prior probability of a research finding being true or false is actually an important step. To illustrate that consider this: A researcher group presents data that shows that a certain brain region is associated with the full symptom spectrum of depression. We know by now that such one-to-one mappings between a certain brain region and a specific disorder does not exist. This makes such finding a priori very unlikely and might be a first indicator that the finding might be not replicable.
2. The relationship between power, alpha and sample size.
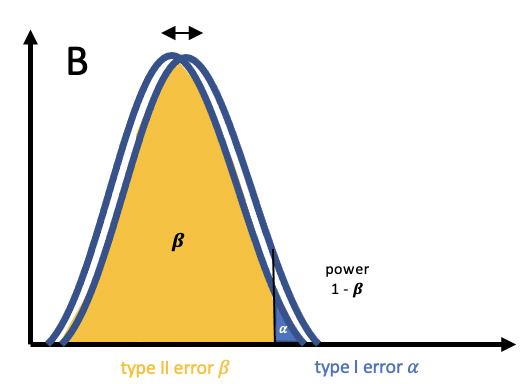
For a refresher on the relationship between power, and sample size, see my previous post. One very interesting (and concerning) consequence of low sample size and resulting low power is that the power (the probability of correctly rejecting the null hypothesis) can fall BELOW the set rate:
Graphically this looks like the following:

The consequence of this is that a significant effect is more likely a false positive than a true result!
3. The post study probability: the positive predictive value (PPV)
We have now learned about the pre-study odds and probabilities. However, in research we do not stop here. Instead, we conduct a test with a certain power and a set type I error rate .
We thus weigh the probabilities of a prior association and a prior non-association with the “likelihood"s” and to get the related posterior probabilities. If we have a closer look we can also see that these tow probabilities cover all the cases that a research finding F+ can come up as “true” in a study when the underlying association is actually true A+:
and
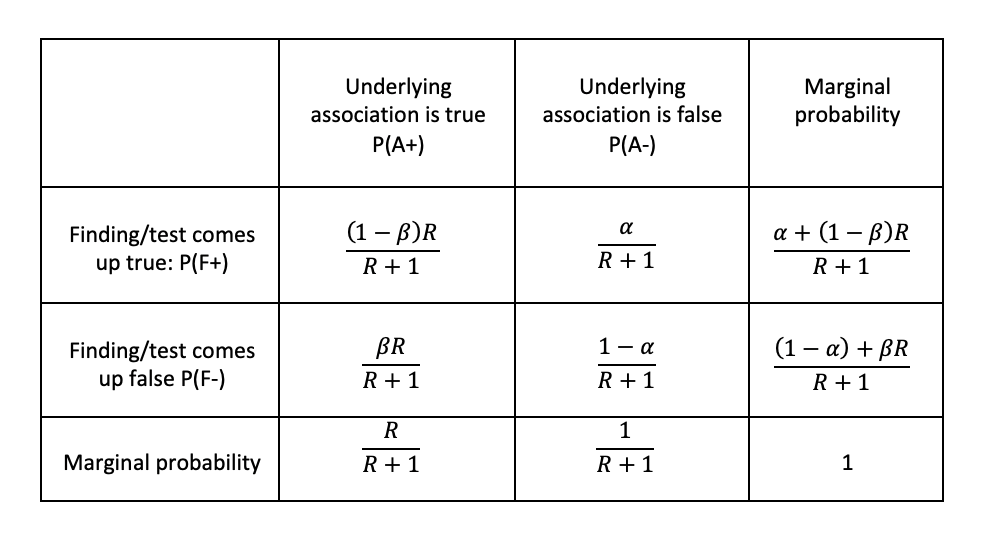
The first case P(F+|T+) describes the case that a finding comes up as true and is, indeed, true. teh second case P(F+|A-), describes the event that the finding comes up as true and is not true, or better, a type I error.
Together, these two probabilities span the events in which a positive finding comes up P(F+):
These probabilities are summarized in the following table:
